
Satellite evidence of physical change, measured and dated.
Elvermont turns multispectral satellite imagery into independent, defensible evidence of how large sites change.
Scroll to descend ↓
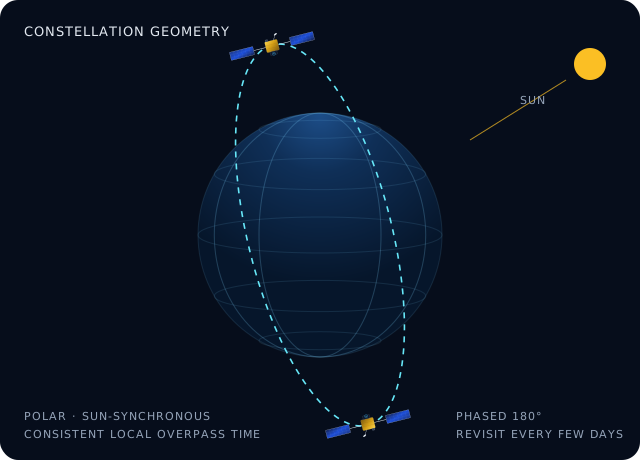
A consistent view of every large site, every few days.
Polar-orbiting multispectral satellites image the whole country at the same local time, building a multi-year archive.
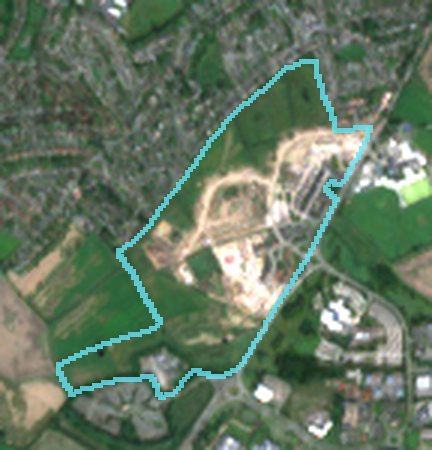
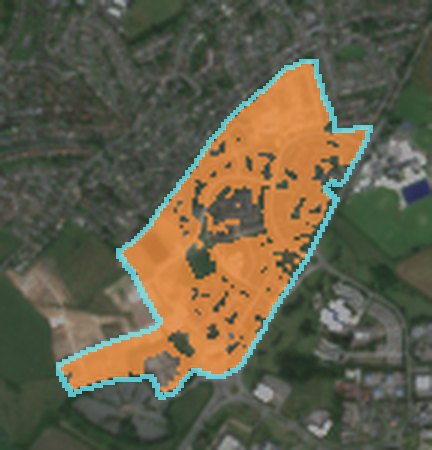
North West England.
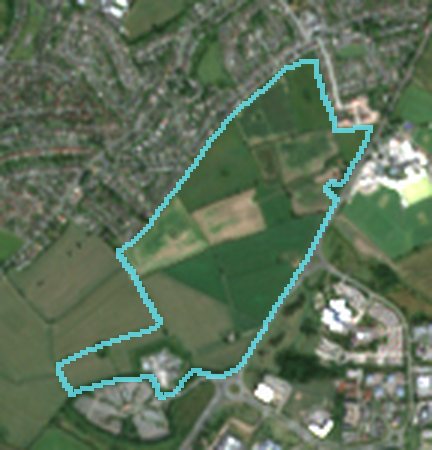
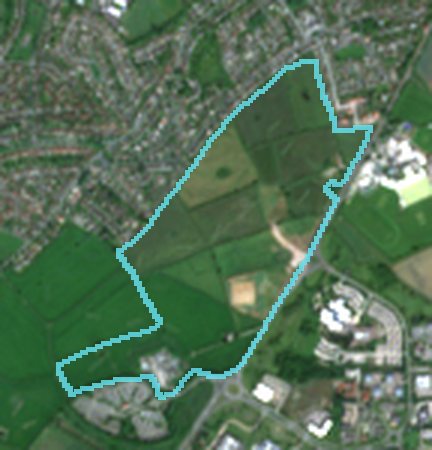
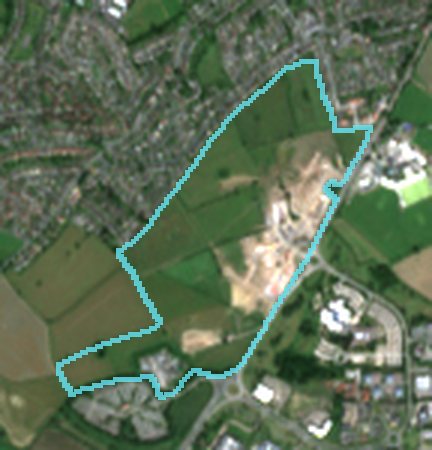
One of the sites we have analysed — a representative example, not client work.
Down to 10 m pixels.
Every pixel radiometrically calibrated, cloud-screened and compared like for like, season by season.
2018
0.0 ha of ground cleared or built over since 2018
39.1 ha of new neighbourhood, evidenced capture by capture.

Satellite evidence of physical change, measured and dated.
Elvermont analyses multispectral satellite imagery to measure how land and built environments change — clearance, extraction, construction, restoration — and turns it into independent, defensible evidence for decisions about large sites.
Seven years of change, in one gesture.
Move across the image to compare the same 155 ha footprint in 2018 and 2025. Everything you see is measured: 141.3 ha of change, 91% of the site.
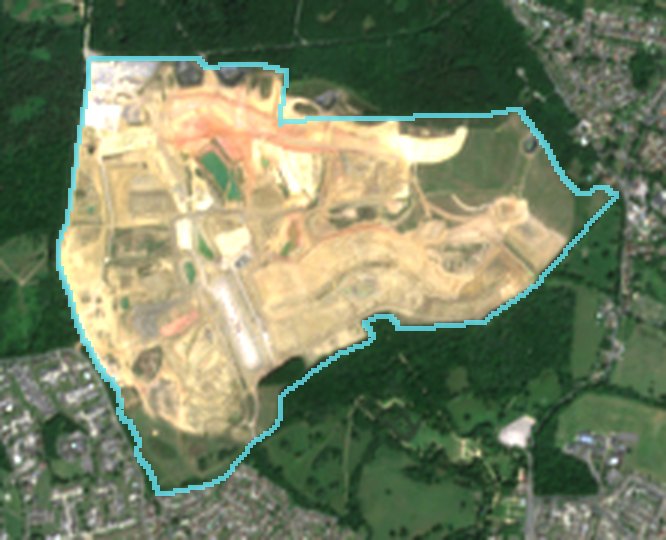
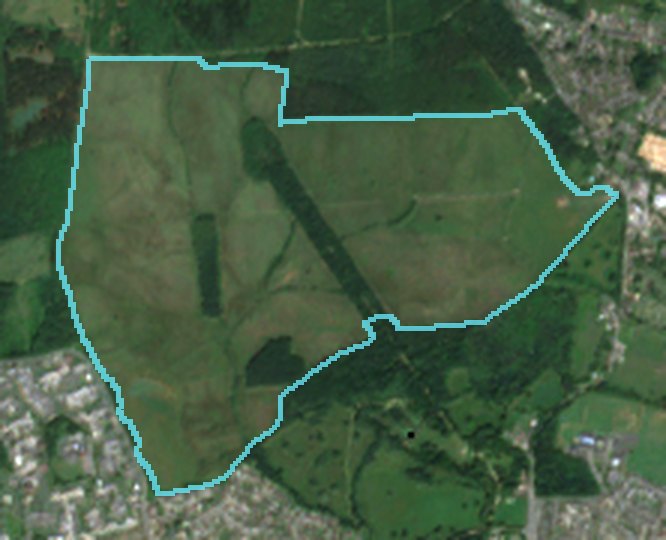
RESERVOIR CONSTRUCTION EARTHWORKS · SOUTH EAST ENGLANDREPRESENTATIVE ANALYSIS · NOT CLIENT WORK
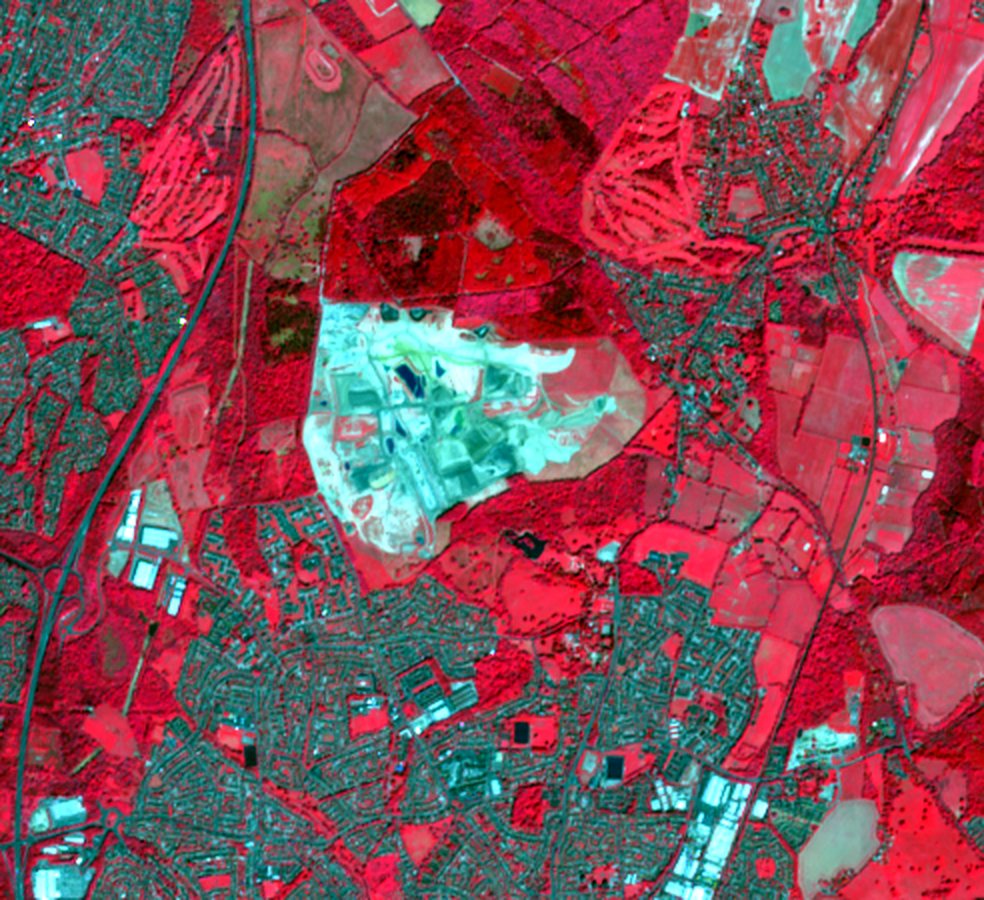
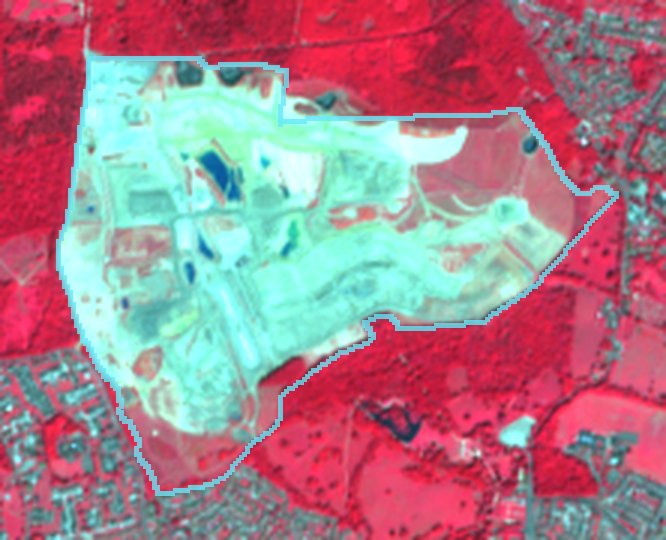
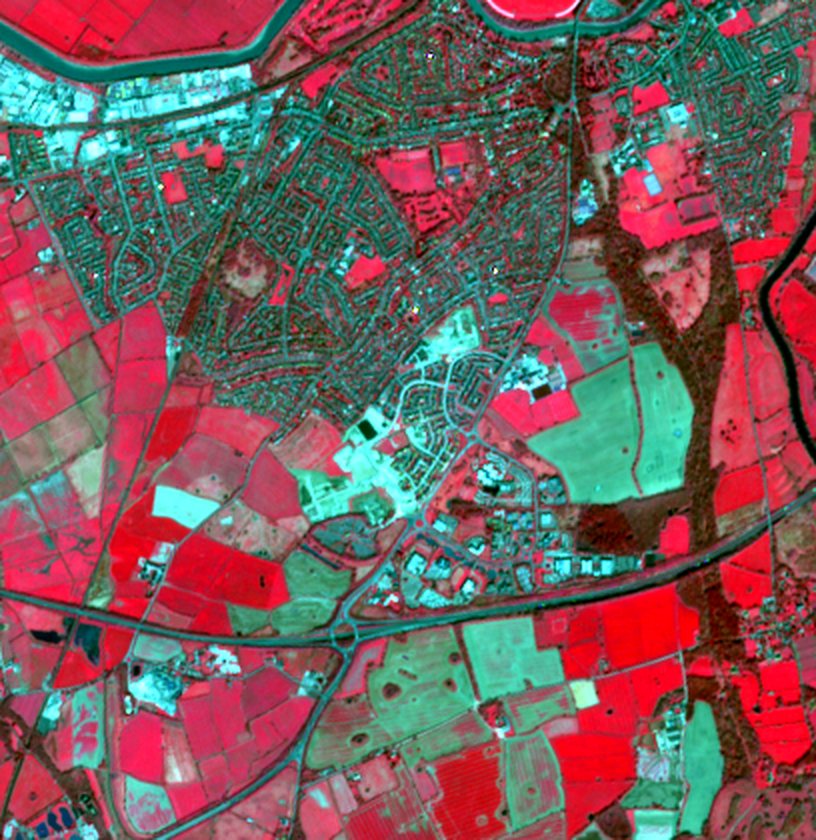
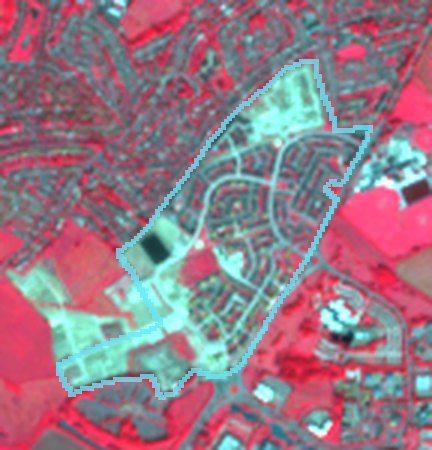
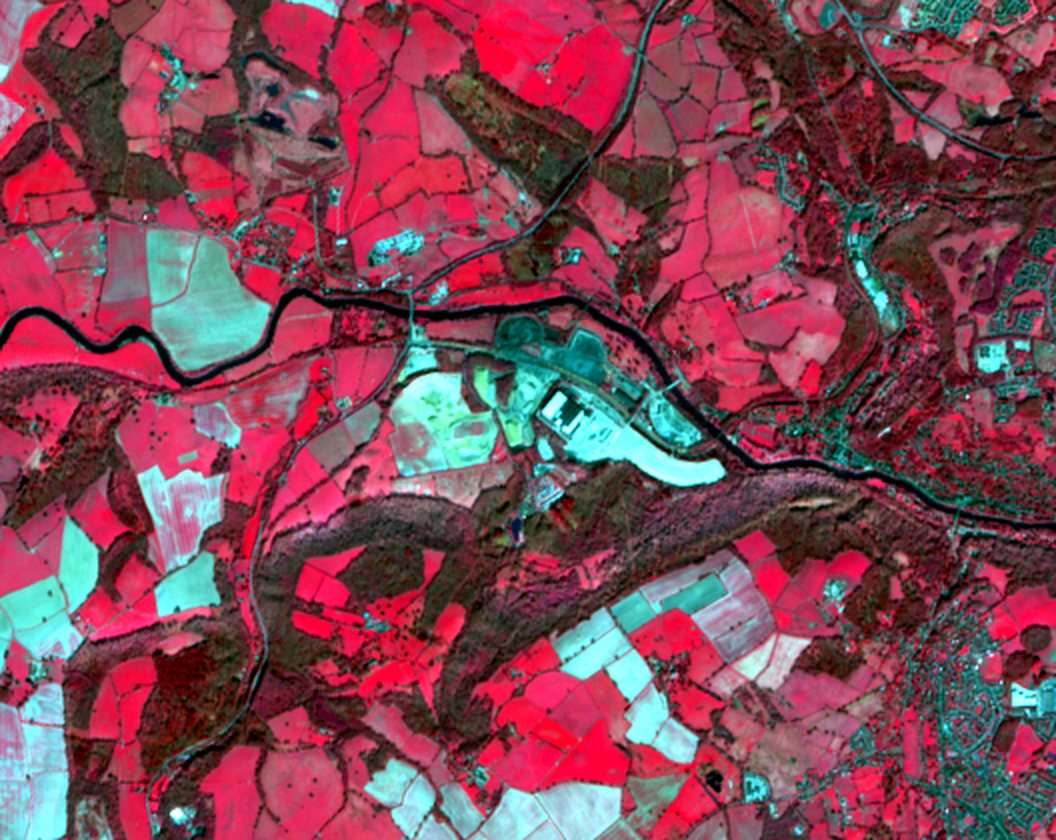
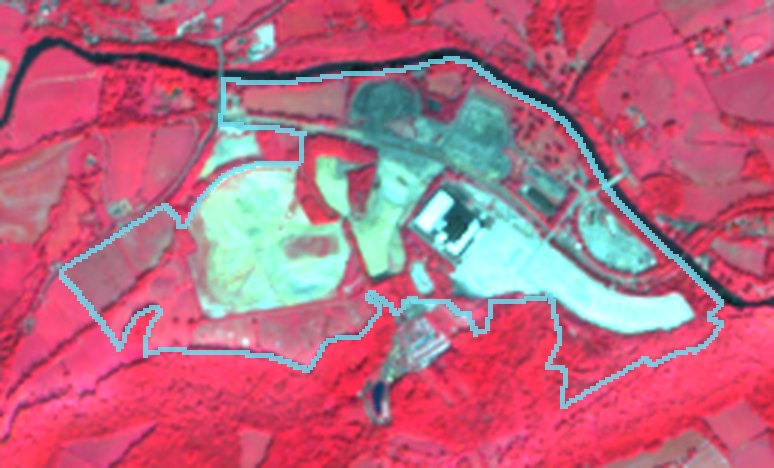
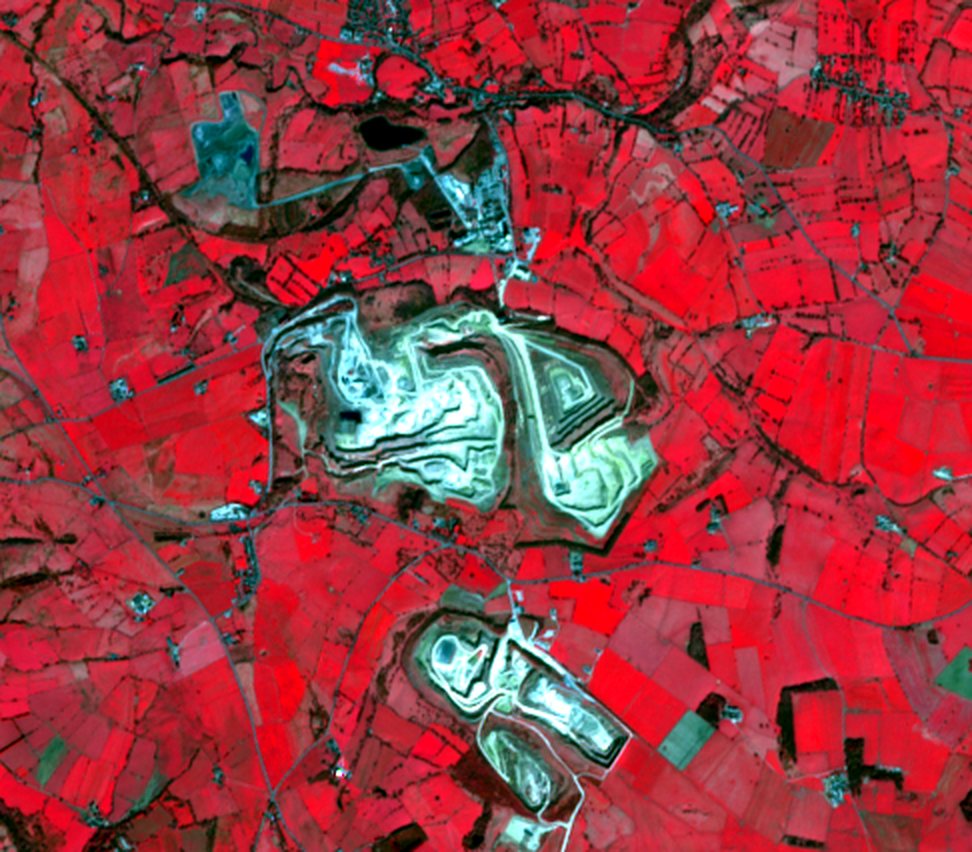
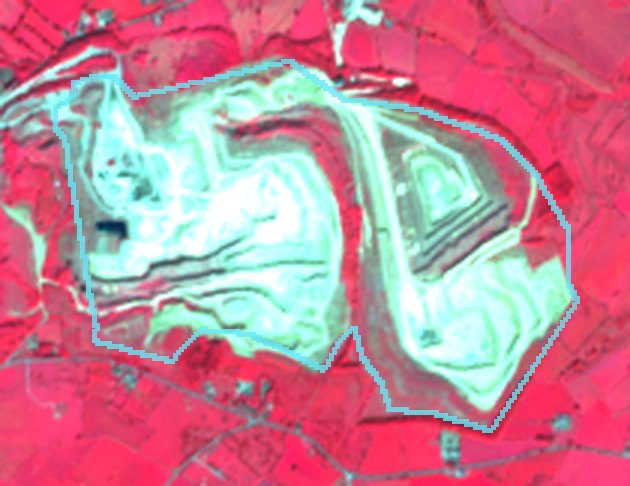
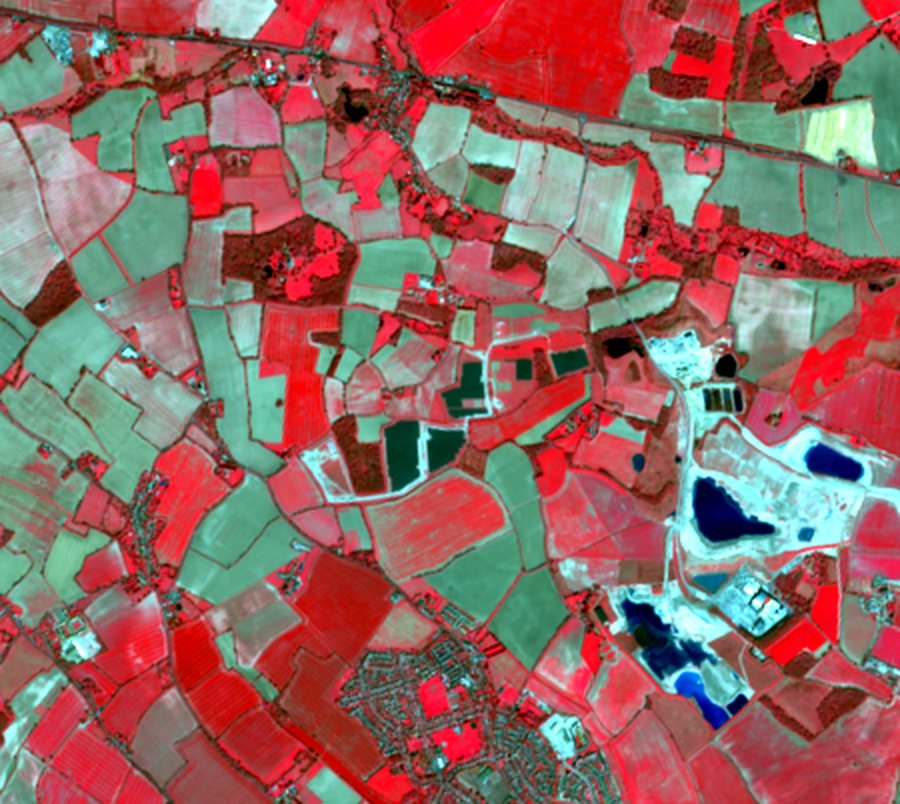
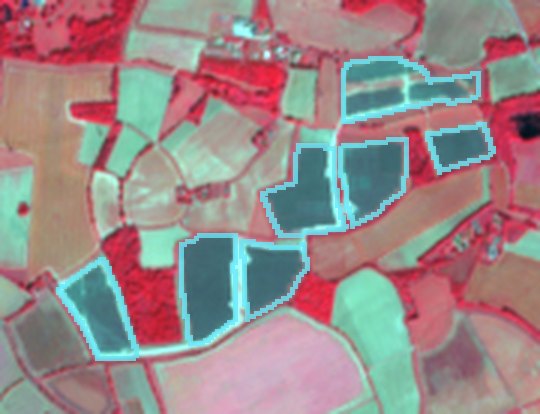
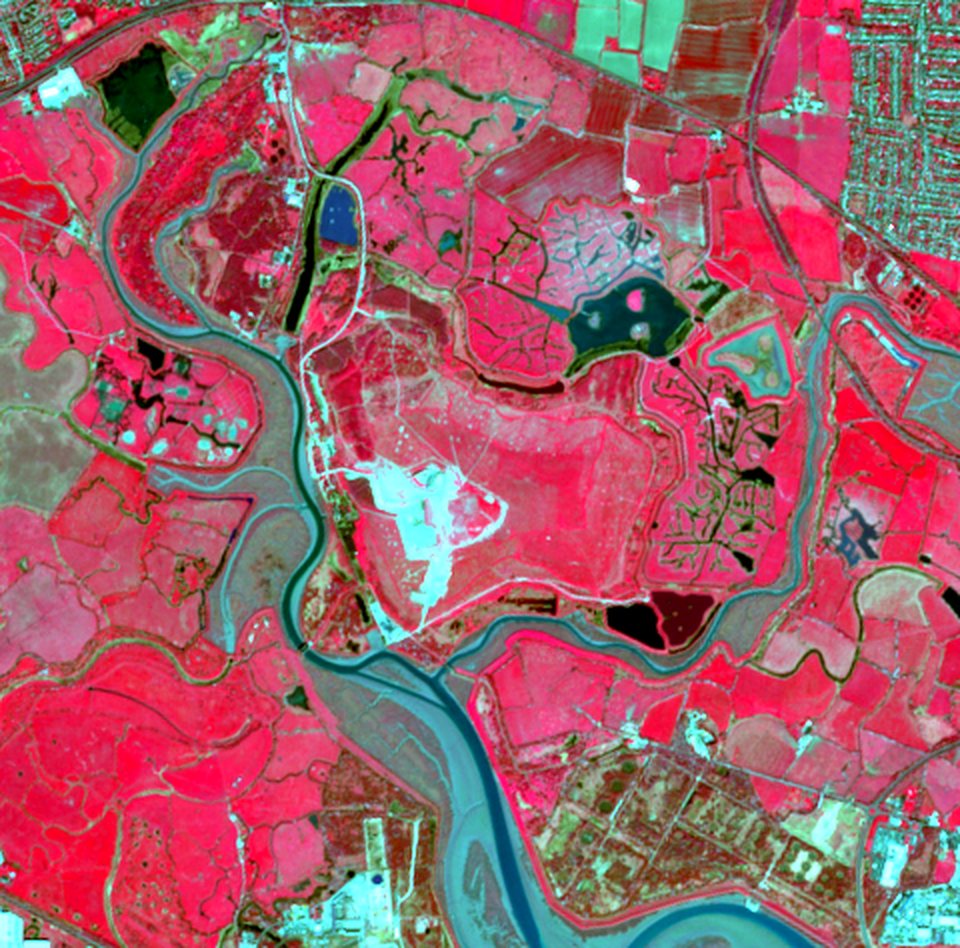
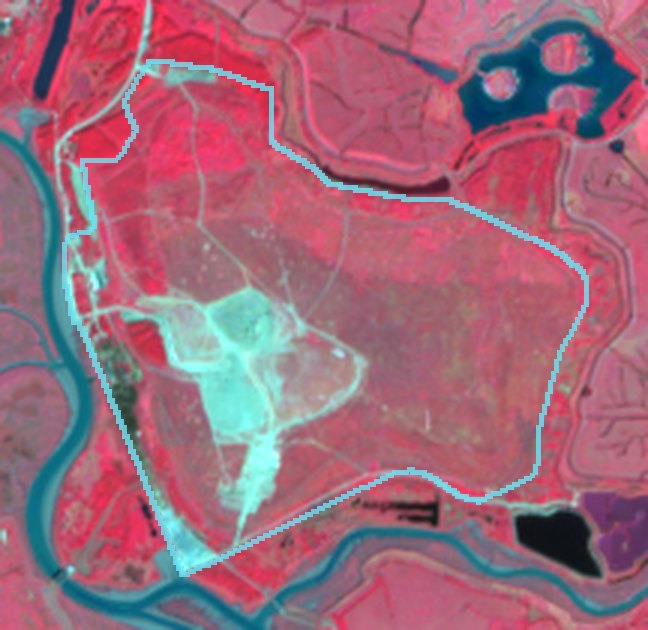
Near-infrared composites from Elvermont analyses — healthy vegetation renders red, bare ground and built surfaces cyan-grey.
Physical change you can see, quantify and defend.
Spectral signatures separate vegetation, bare earth, water and engineered surfaces. Comparing like-for-like seasons isolates genuine change from weather, shadow and the farming calendar.
Clearance & earthworks
Vegetation removal, soil stripping, haul roads and platform construction — mapped and measured in hectares.
Extraction & restoration
Quarry face advance, new extraction cells, stockpiles and the return of vegetation on restored ground.
New built footprint
Housing, warehouses, yards, hardstanding and infrastructure appearing on previously open land.
Energy infrastructure
Ground-mounted solar arrays and associated works, from first disturbance to completed build-out.
Water extent
Lagoons, reservoirs and flooded workings — open-water extent tracked through the short-wave infrared.
Land condition
Vegetation vigour and bare-soil indices over time, separating real change from seasonal variation.
The near-infrared tells a different story.
Plants reflect strongly in near-infrared light the human eye cannot see. Move across the image to look through a spectral lens: vegetation glows red, while new roads, roofs and bare ground stand out in cyan.
- Separates vegetation loss from shadow and colour change
- Reveals construction phases before they look finished
- The same physics drives every index we measure
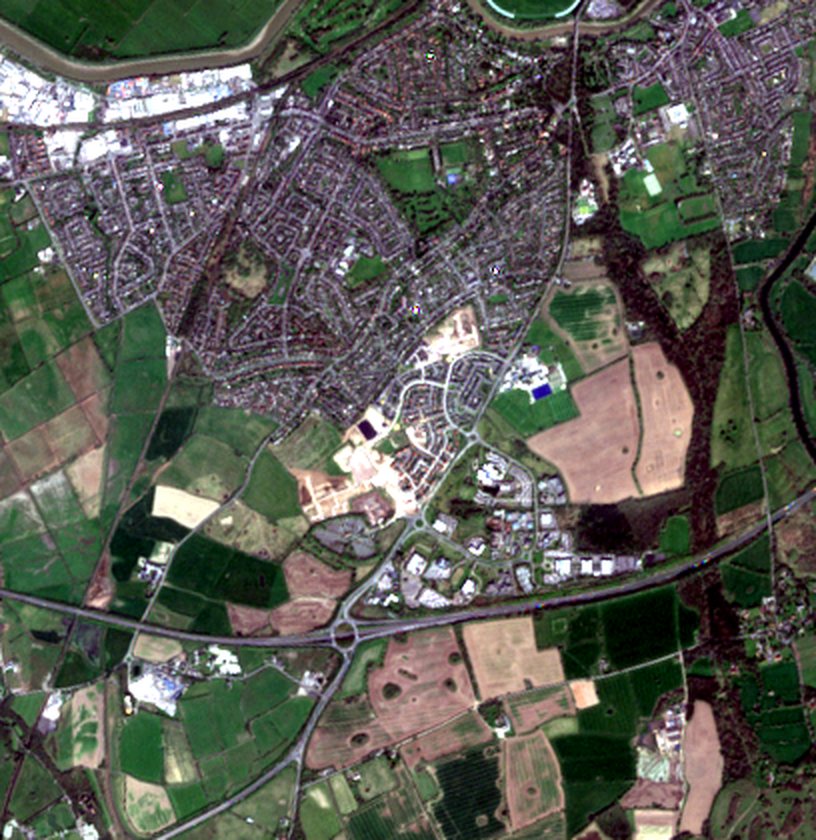 Move or drag to see in near-infrared
Representative analyses
Examples produced by Elvermont from archive imagery to show the method across different site types. They are not client work; locations are described at regional level only.
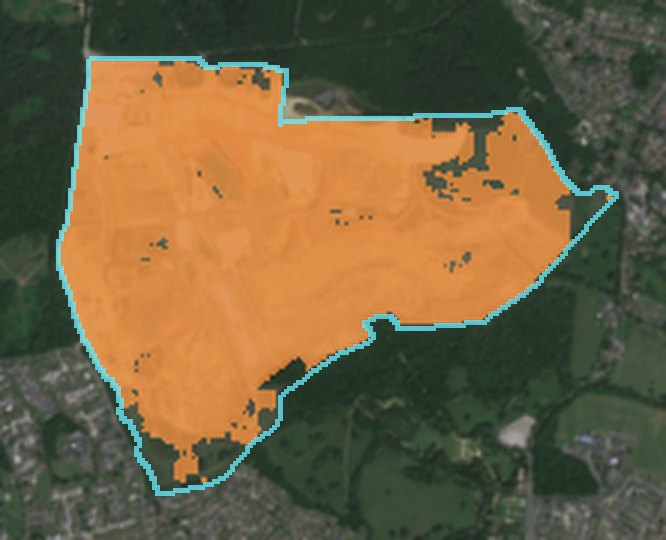
Reservoir construction earthworks
141 ha of change · 91% of site
Apr 2018 – Sep 2018 → Apr 2025 – Sep 2025 · South East England
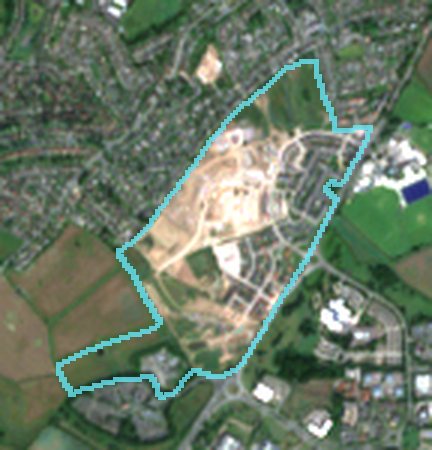
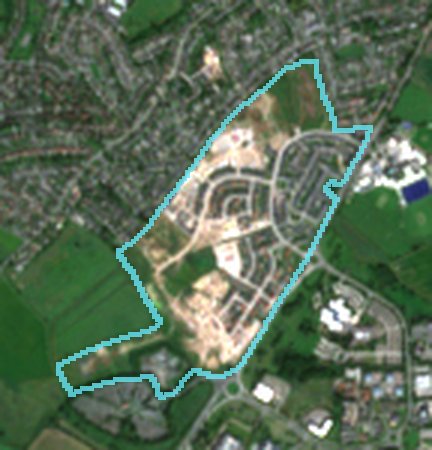
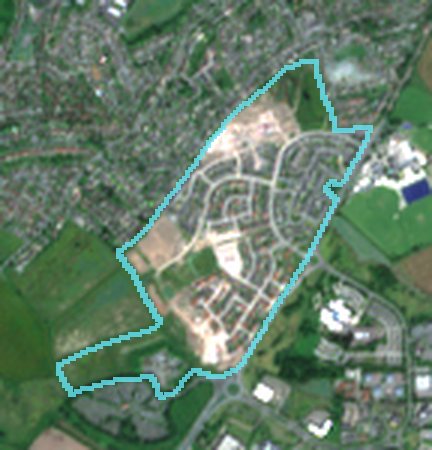
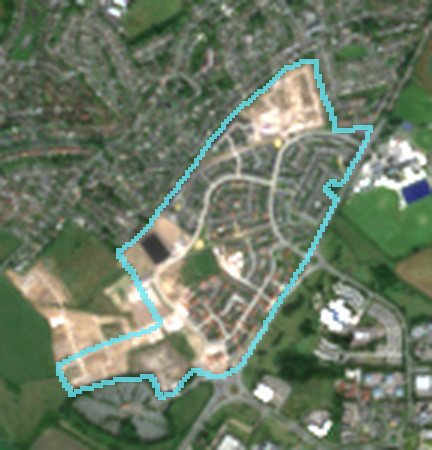
New residential neighbourhood
39 ha of change · 79% of site
Apr 2018 – Sep 2018 → Apr 2025 – Sep 2025 · North West England
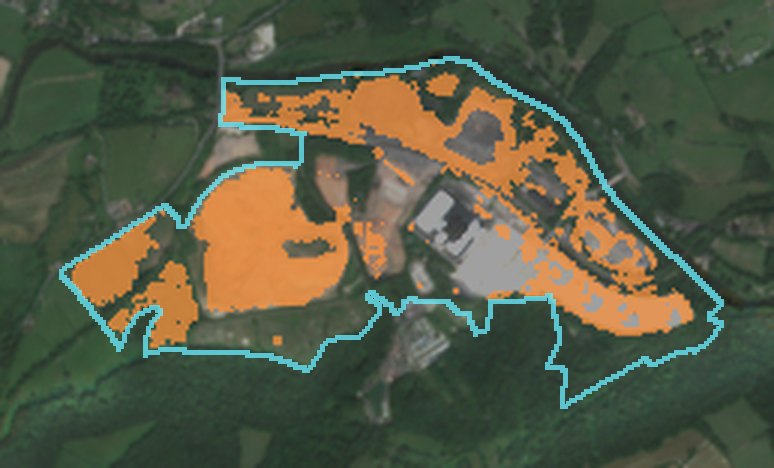
Former power station redevelopment
55 ha of change · 40% of site
Apr 2018 – Sep 2018 → Apr 2025 – Sep 2025 · West Midlands
Bespoke by default. Simple from the first conversation.
You don't need to know anything about satellites. Tell us the site and the decision you're facing; we design the analysis around it.
Talk to us
A short call or email: the site, the period and what you need to know. No forms to master, no software to install.
We design the analysis
We check what the imagery can show for your dates and propose the measurements, outputs and cadence that answer your question.
You receive evidence
Dated, measured, plainly written results — reports, data and imagery — ready to use in your own decisions and documents.
What we deliver today — and where we're taking it.
Every engagement starts from proven capability; bespoke work and new data sources extend it to fit your question.
Change evidence
- Construction, earthworks and clearance
- Extraction advance and restoration
- Energy infrastructure build-out
- Water extent and land condition
- Multi-year historical timelines
Designed around you
- Portfolios, territories and site lists
- Recurring monitoring programmes
- Custom indicators and outputs
- Very-high-resolution imagery, sourced per project
Coming capabilities
- All-weather radar monitoring through cloud
- Automated change alerts
- Data delivery by API and dashboards
- Habitat and biodiversity condition tracking
- Elevation and volume change
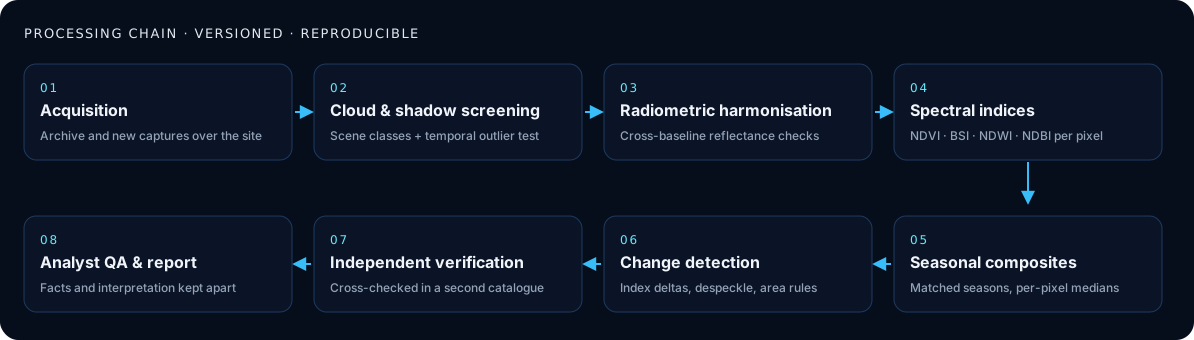
A versioned, reproducible processing chain.
Every result passes through the same audited steps — from per-pixel cloud screening to independent catalogue verification and analyst review — and is stored with the exact captures and method version that produced it.
Tested blind against official records.
Before offering the method we tested it against an independent UK government register of energy projects, using pre-registered thresholds.
Built for decisions about large sites.
Infrastructure and energy, property and logistics, housebuilding, extraction and restoration, land and environmental advisory, investors and analysts.
Have a site in mind?
Tell us the location and the question. We'll tell you what the imagery can show before anything is agreed.